Still Managing U.S. College Applications Across a Dozen Tabs? This Skill Connects the Whole Journey
Provide a student profile, SAT or ACT scores, and target schools. Get score positioning, school evaluations, comparisons, deadlines, tracking, scholarship reviews, and financial-aid analysis without invented admission probabilities.
Official score bandsMulti-dimensional school reviewReusable application recordEvidence and integrity checks
02 BEFORE / AFTER
From scattered research to one application workflow that keeps moving forward
Before
You know the score, not the position
Your test score, campus admit rate, and school data live on separate pages. None of them alone explains where you sit among enrolled students.
After
Enter a score and target school to see the official 25th, 50th, and 75th percentile bands and your relative position.
Before
School comparisons become spreadsheet assembly
Programs, cost, admissions, campus life, and career information come from different sources and rarely use the same standard.
After
Evaluate schools in one framework while keeping evidence status and provisional limits visible.
Before
Every stage starts over
Research, essays, scholarships, aid, deadlines, and application status are stored separately, so earlier work rarely becomes useful context later.
After
Move evaluated schools into a tracker and deadline dashboard, creating an application record that can keep growing.
Data date and population
Data version: College Scorecard release dated 10 June 2026. Demonstration run: 21 August 2026. Statistical year: not specified in this example; check the source year before use. The release date is not the enrollment year. Population: enrolled first-year undergraduates with reported SAT/ACT scores, at campus level. These bands describe neither all admitted applicants nor an individual admission probability.
Use full institution names, such as Massachusetts Institute of Technology. Abbreviations can return the wrong school or no match; confirm the campus in the result.
03 PAIN POINT / USE CASE
The hard part is not finding information. It is connecting it without losing context or judgment.
School websites explain programs and rules. College Scorecard supplies campus-level data. Spreadsheets track status, calendars hold deadlines, and general-purpose AI handles summaries or drafts. Each tool completes a fragment, while the applicant still has to decide what is comparable, what must be rechecked, and what evidence is safe to use.
That gap creates real risk. A campus admit rate can be mistaken for a personal probability. Loans can be presented like gift aid. An essay assistant can produce polished prose from experiences the student never had.
04 TRANSITION
Applicants do not need another isolated answer. They need a workflow that preserves context and boundaries.
Establish who the student is and where the scores stand, then let school research, materials, funding, and execution share the same factual base.
05 SOLUTION
Enter the core profile once, then let each result become the starting point for the next task
01 InputStudent stage, academics, SAT or ACT, activities, budget, international status, and target schools.
02 Skill workflowPosition scores, evaluate schools, compare options, gate essay materials, review scholarships and aid, and record evidence status.
03 OutputHTML, JSON, and Markdown reports plus an application tracker, deadline dashboard, and reviewable next steps.
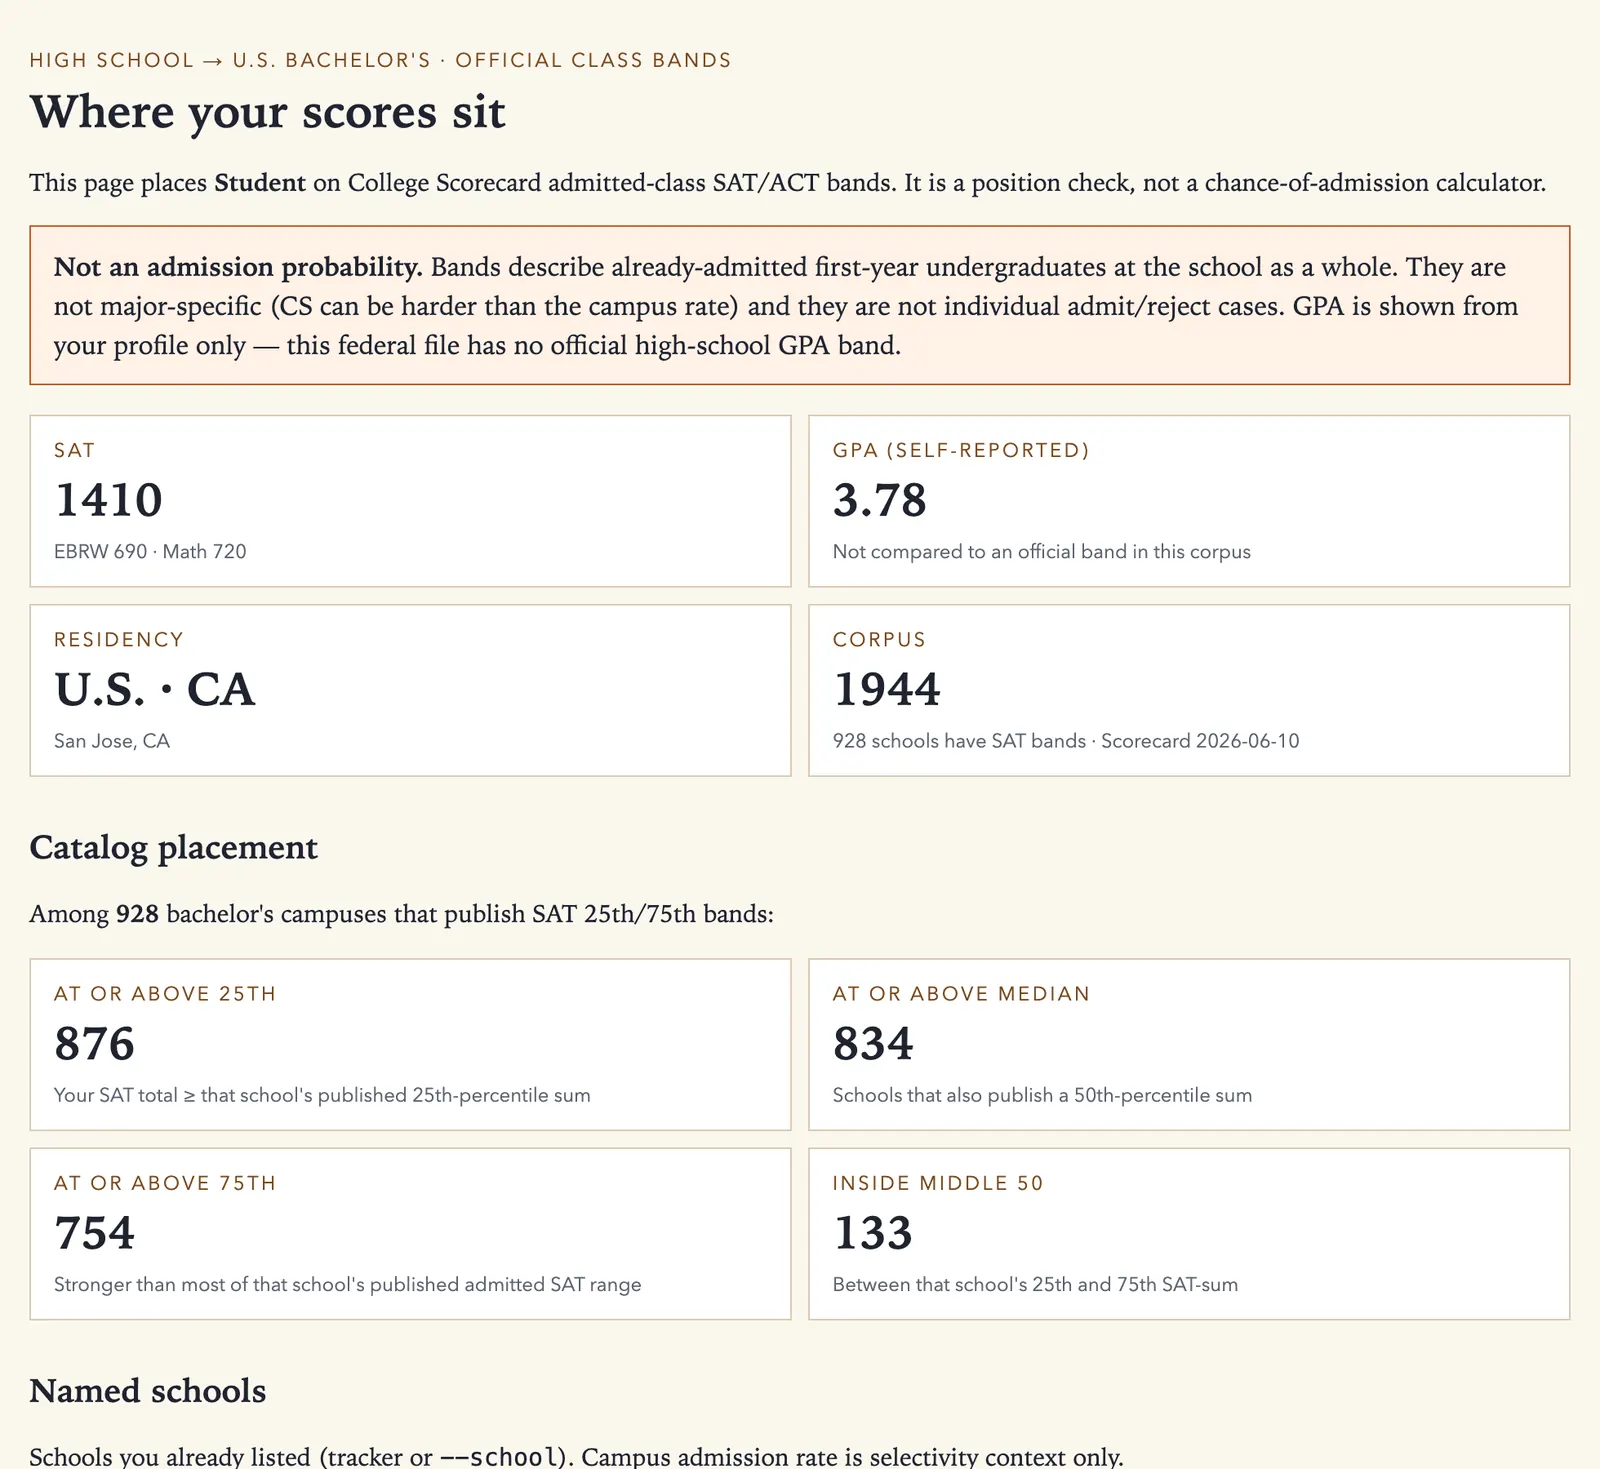
Same demonstration as Showcase and Benchmark: San Jose, class of 2027; SAT 1410 (EBRW 690, Math 720), GPA 3.78 unweighted / 4.21 weighted, annual budget $30,000.
06 REAL CASES / OUTPUTS
One run, three views of the same SAT 1410 report
REPORT EXCERPT
01 · Named schools and missing bands
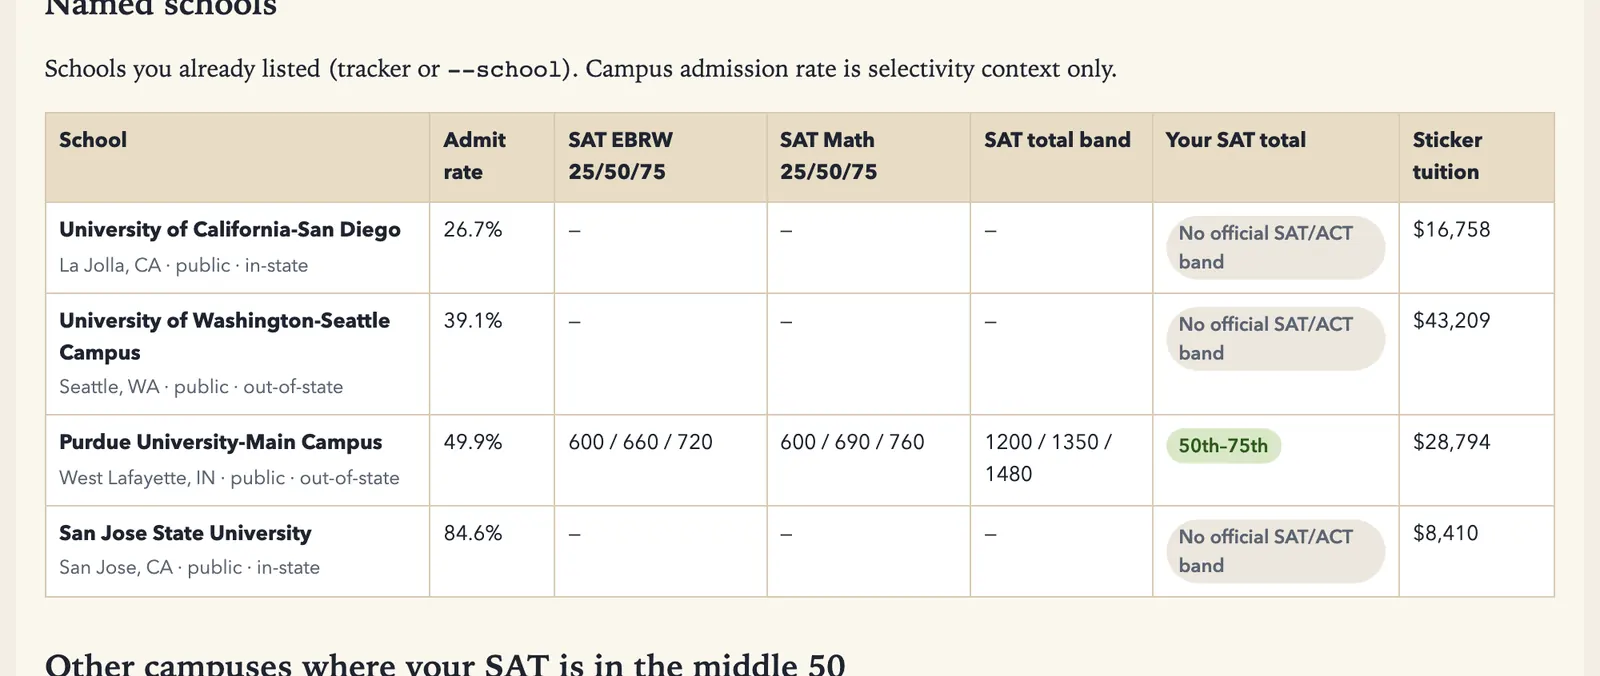
Purdue University–Main Campus has a published 1200 / 1350 / 1480 SAT band; 1410 falls in the 50th–75th interval. University of California–San Diego, University of Washington–Seattle Campus, and San Jose State University have no official SAT/ACT band in this report. Missing data stays missing.
Named-school results from the SAT 1410 report.REPORT EXCERPT
02 · Catalog position, not school recommendations
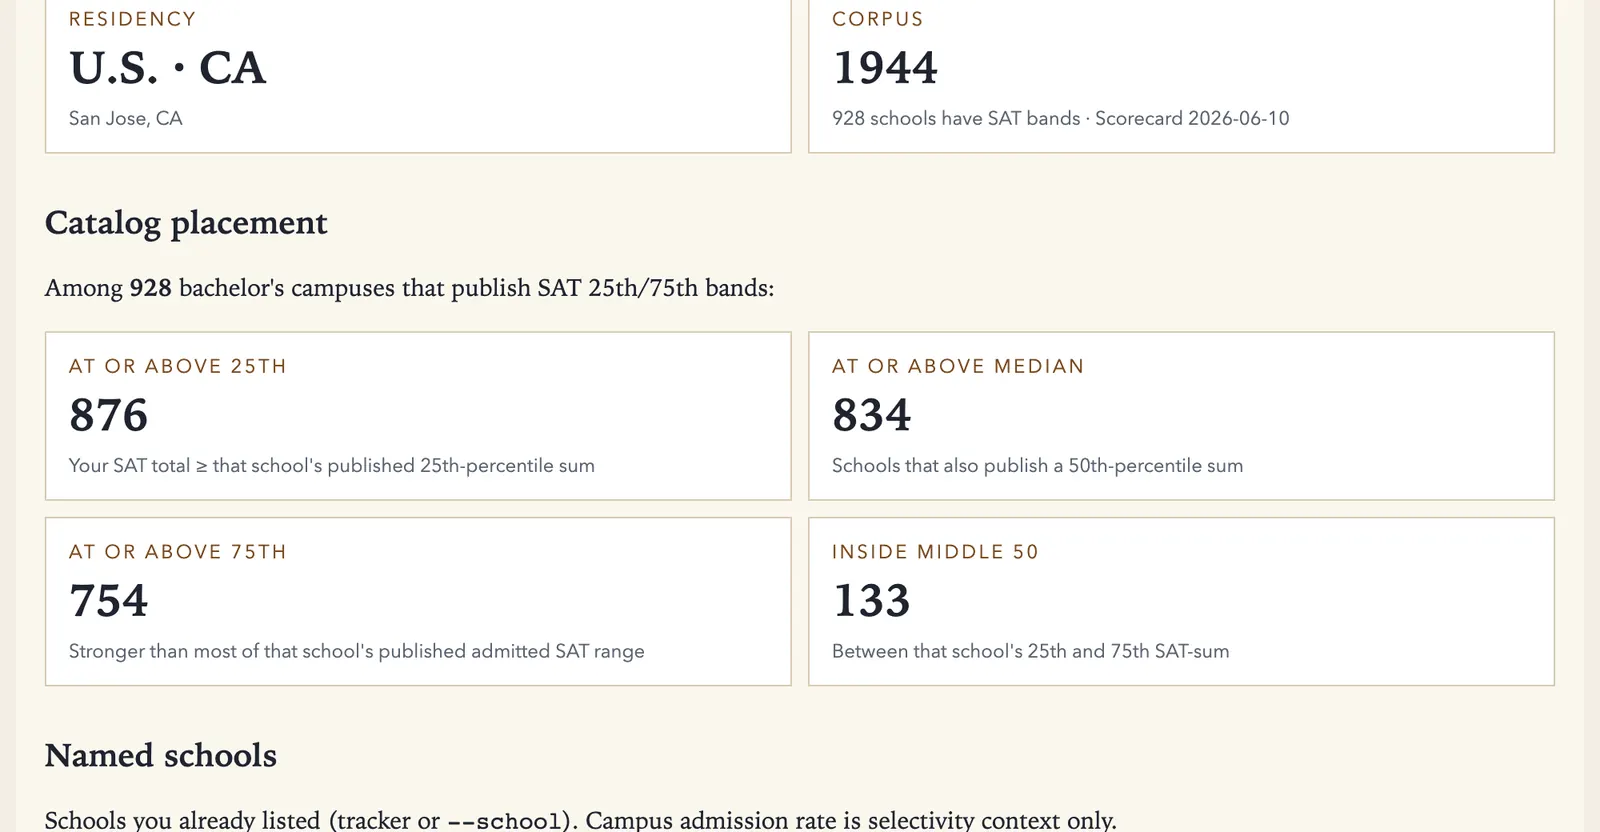
The report contains 1,944 campuses, including 928 with SAT bands. SAT 1410 is at or above the 25th percentile at 876, the median at 834, and the 75th percentile at 754; it falls inside the middle 50% at 133. These categories overlap and must not be added together.
Catalog counts from the same report and data release.REPORT EXCERPT
03 · Read comparable examples with context
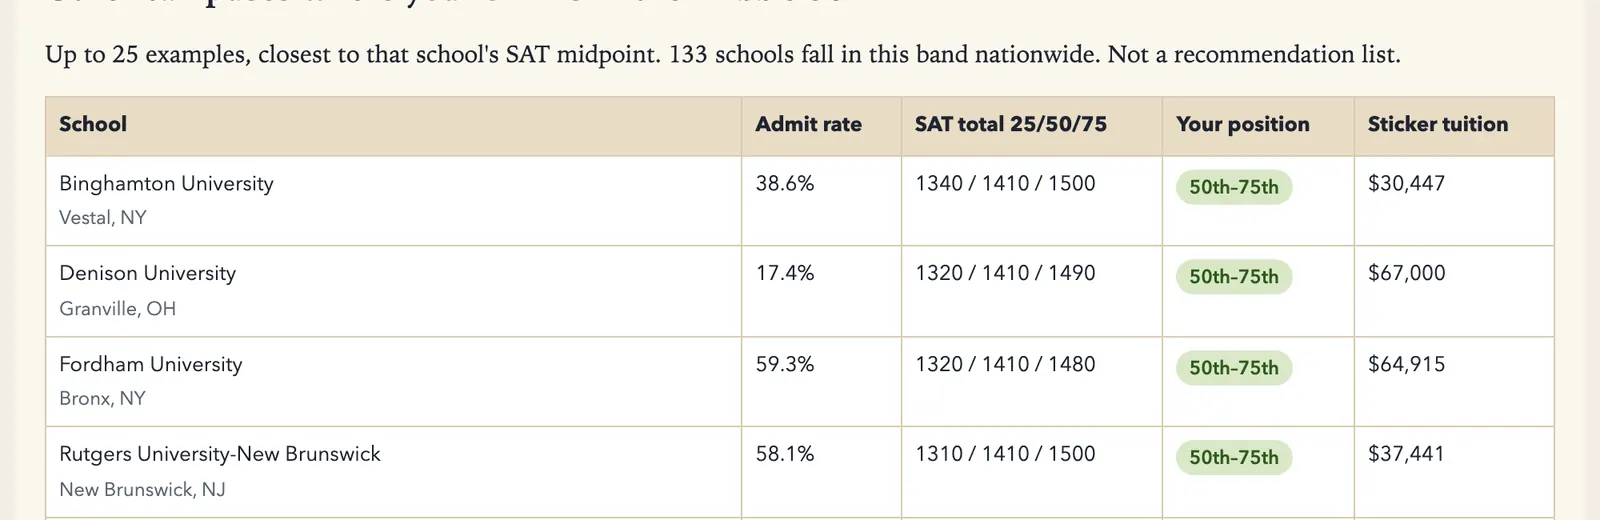
The report displays up to 25 examples ordered by distance from each school’s SAT midpoint. A similar score band does not establish academic, financial, program, or personal fit.
Middle-50% examples; the report explicitly labels them as not a recommendation list.
07 CORE ADVANTAGES
The differentiation is not more output. It is more reviewable judgment.
No invented personal admission odds
The Skill positions SAT or ACT scores against official College Scorecard bands and makes clear that campus data is not a major-level or personal admission probability.
Evidence status stays visible
A completed evaluation is not ranked as though it were equivalent to a public-data-only result. Users can see what supports a conclusion and what is still missing.
Real material comes first
Essay work requires genuine student experiences. When material is missing, collect facts and build an outline before drafting.
Check the inputs before trusting the output
Confirm SAT 1410 = Math 720 + EBRW 690 and verify each full school name and campus. A successful duplicate-name test does not establish reliable abbreviation matching.
08 WHY IT MATTERS
The earlier the application record starts, the less often the applicant has to rebuild the same context
Score positioning can feed a school evaluation. Evaluations can feed comparisons. Comparisons can move into tracking and deadlines. Later, offers can move into aid and net-price analysis. The durable asset is not one answer; it is the student facts, sources, limits, and next actions preserved across the full decision process.
09 CTA
US Undergrad Admit Bench
Start with official score positioning and build a U.S. undergraduate application record that lasts through the full cycle.
Provide A verified student profile, SAT or ACT scores, target schools, and the school, document, scholarship, or aid task you need to handle.
Receive Reviewable score positioning, school reports, comparisons, tracking, deadlines, and concrete next steps.
Recheck current-cycle school policies, deadlines, costs, scholarships, and immigration rules before any real application decision. Tutorial demo data must never be treated as applicant fact.